Mapping Overlaps in Global Sports Calendars: Soccer Seasons, Tennis Tours, and Thoroughbred Racing Circuits
Written by Dana Flores · Aug 25, 2026
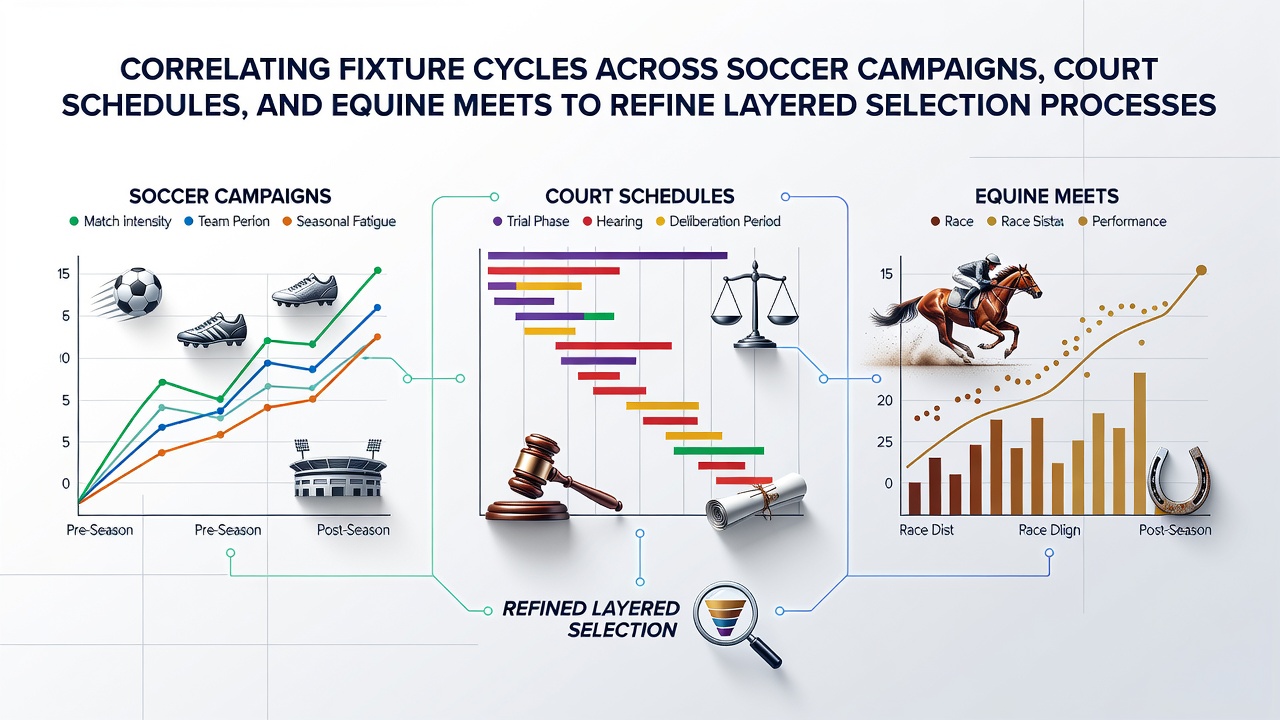
Mapping Overlaps in Global Sports Calendars: Soccer Seasons, Tennis Tours, and Thoroughbred Racing Circuits
Analysts track fixture cycles across major soccer leagues, tennis tours, and horse racing circuits because these patterns create measurable overlaps that influence selection frameworks in multi-event forecasting. Data from the 2025-2026 seasons shows that the English Premier League and Bundesliga typically resume in mid-August, while the ATP and WTA tours stage hard-court events in North America and Asia during the same window, and several Group 1 thoroughbred races occur at venues in Europe and Australia.
August 2026 schedules place the Community Shield on August 9 alongside the start of the US Open Series, and this timing coincides with late-summer flat racing festivals at Deauville and York. Observers note that these concurrent periods produce denser data sets for correlation models because participant availability, travel demands, and recovery intervals intersect across disciplines.
Calendar Structures and Seasonal Phases
Soccer campaigns divide into pre-season friendlies, league opening weeks, international breaks, and winter pauses, whereas tennis grand slams and Masters 1000 events follow a fixed annual rotation that shifts surfaces from clay to grass to hard courts. Equine meets operate on turf and all-weather surfaces with distinct spring, summer, and autumn peaks. Researchers at the University of Sydney have documented how the Australian spring racing carnival aligns with the tail end of European soccer seasons, creating cross-hemisphere data points that refine timing variables in layered selection algorithms.
Those who examine fixture density find that soccer teams playing midweek Champions League matches often face compressed recovery before weekend league fixtures, while tennis players navigate back-to-back tournaments with limited rest. Horse racing trainers adjust campaign lengths based on ground conditions and distance categories. When these constraints overlap, statistical models gain precision by weighting recent form against cumulative workload indicators rather than isolated results.
Data Integration Methods
Layered selection processes combine historical performance metrics from each sport into unified databases. Soccer analysts record goal differentials, set-piece efficiency, and fixture congestion indices. Tennis statisticians log break-point conversion rates, serve percentages on specific surfaces, and travel-adjusted fatigue scores. Racing databases capture sectional times, barrier draws, and trainer patterns across distance bands. When these data streams merge, correlation coefficients emerge that highlight periods when one sport's momentum indicators reinforce or contradict trends in another.

According to figures released by the European Commission on sport participation trends, synchronized scheduling peaks occur roughly every 18 months when major soccer leagues, tennis slams, and international racing festivals converge. Models that incorporate these peaks adjust selection thresholds by increasing emphasis on recent surface-specific or distance-specific results while reducing reliance on older baseline data.
Practical Applications in Multi-Event Forecasting
Forecasters apply correlation matrices to identify when soccer team rotations due to fixture pile-ups coincide with tennis players exiting early from tournaments because of travel fatigue. In such windows, equine selections may emphasize horses with proven records after short layoffs. One documented case from the 2024-2025 cycle showed that English Premier League sides with European midweek commitments posted lower expected goal values in the following weekend, while certain ATP players returning from Asian swings recorded reduced first-serve percentages upon returning to Europe. Racing yards that targeted late-summer targets produced measurable strike-rate improvements when those same dates aligned with reduced soccer and tennis activity.
Industry reports from the Canadian Gaming Association indicate that operators monitoring cross-sport workload data have refined risk parameters for multi-leg selections by factoring in these cyclical overlaps. The approach avoids treating each sport in isolation and instead treats the calendars as interconnected systems where one discipline's congestion can signal opportunities or cautions in another.
Conclusion
Correlating fixture cycles across soccer campaigns, tennis court schedules, and equine meets supplies a structured method for refining layered selection processes. The technique relies on documented overlaps, workload metrics, and surface-specific or distance-specific performance data rather than isolated event analysis. As calendars for 2026 continue to unfold, updated datasets will further test the stability of these cross-sport correlations and their utility in multi-event forecasting frameworks.