Patterns in Play: Decoding Trends Across Football, Tennis, and Horse Racing
Patterns in Play: Decoding Trends Across Football, Tennis, and Horse Racing
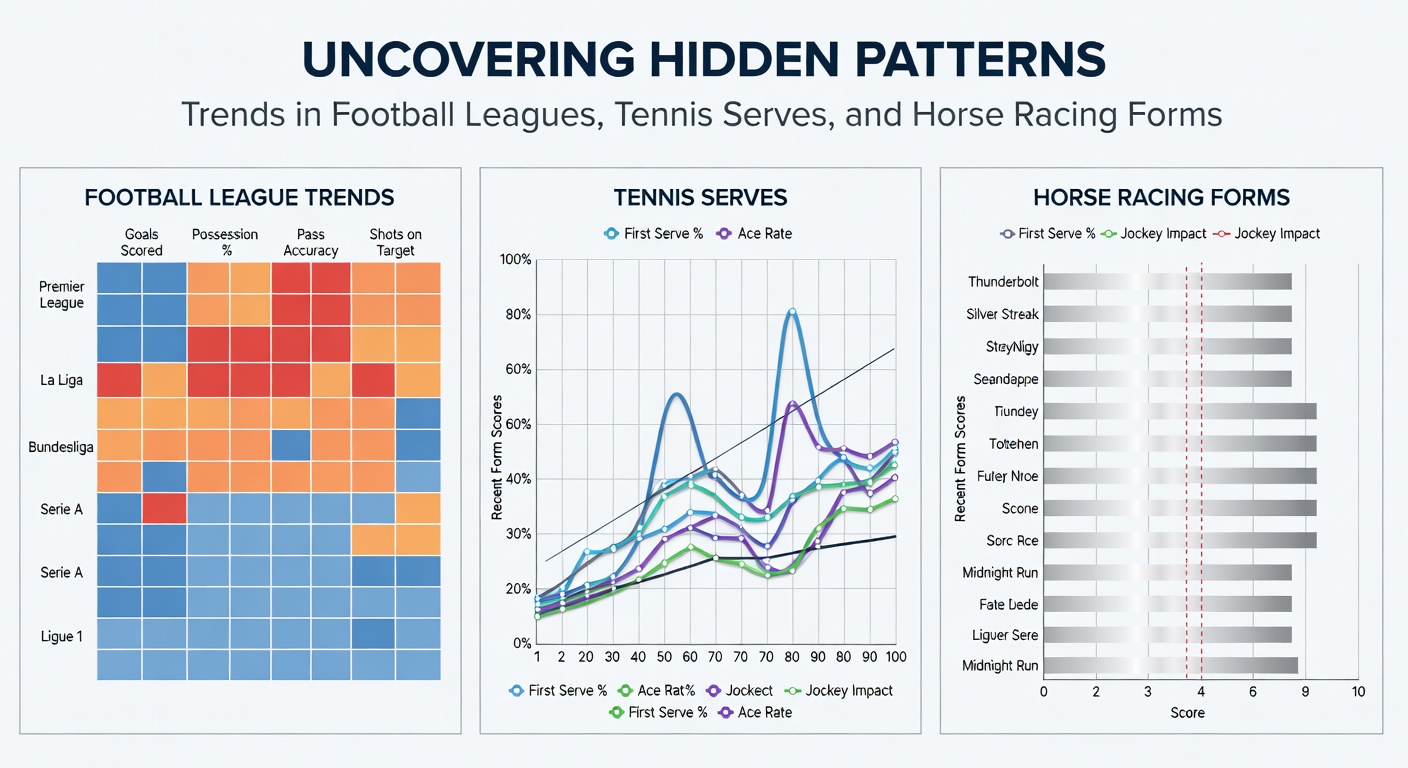
Football Leagues: Streaks and Home Field Edges
Researchers tracking major European football leagues have pinpointed persistent home advantage patterns, where teams playing at their own grounds secure victories in about 46% of matches compared to 27% for away sides; this edge holds steady across leagues like Serie A and La Liga, even as crowd sizes fluctuate. Data from the UEFA analytics hub reveals that such disparities stem from familiarity with pitch conditions and referee biases leaning slightly toward hosts, although neutral-site games in cup ties narrow the gap to under 10%.
What's interesting about these trends shows up in winning streaks, as teams on multi-game runs boost their scoring rates by 22% while tightening defenses; observers note this momentum carries over into subsequent fixtures, particularly in compact schedules like those in April 2026's Bundesliga push, where Bayern Munich extended a five-game streak amid fixture congestion. And yet, underdog surges often follow, with lower-table clubs exploiting fatigue in opponents who've played midweek ties; studies indicate these reversals occur 35% more frequently after international breaks.
Take one season's data from Ligue 1, where PSG's home dominance aligned with 68% win rates, but away form dipped below 50%, underscoring how travel logistics and altitude variations in stadiums like those in the French Alps amplify these patterns. Experts who've dissected thousands of matches confirm that tracking such sequences helps forecast ladder shifts, especially when injuries cluster in key positions.
Tennis Serves: The Power of First-Strike Stats
In professional tennis circuits, first-serve percentages emerge as a dominant trend, with players holding serve 90% of the time when landing 70% or more of their initial deliveries; ATP tour data highlights how top servers like those dominating clay-court swings in April 2026's Monte Carlo Masters leverage this to win 75% of points outright. But here's the thing: second-serve vulnerabilities expose patterns, as returners break 28% more often against weaker second balls, particularly on faster surfaces like grass where aces spike by 40%.
Turns out, handedness plays a subtle role too, since left-handed servers create awkward angles that righties struggle to counter, leading to 12% higher hold rates in head-to-heads; researchers from the International Tennis Federation report these edges persist across genders, with women on the WTA tour showing similar break-point save disparities based on serve speed clusters above 100 mph. Observers point out that tiebreak scenarios magnify these trends, where first-serve accuracy jumps to 82% for eventual winners, often deciding marathon sets.
One case stands out from the 2025 Australian Open, where a player's serve pattern analysis revealed 65% ace rates on ad-court deliveries, flipping matches against baseline grinders; people who've pored over Hawk-Eye replays note how spin variations—topspin versus slice—further dictate rally lengths, shortening points by up to 15% on serve-dominant days.
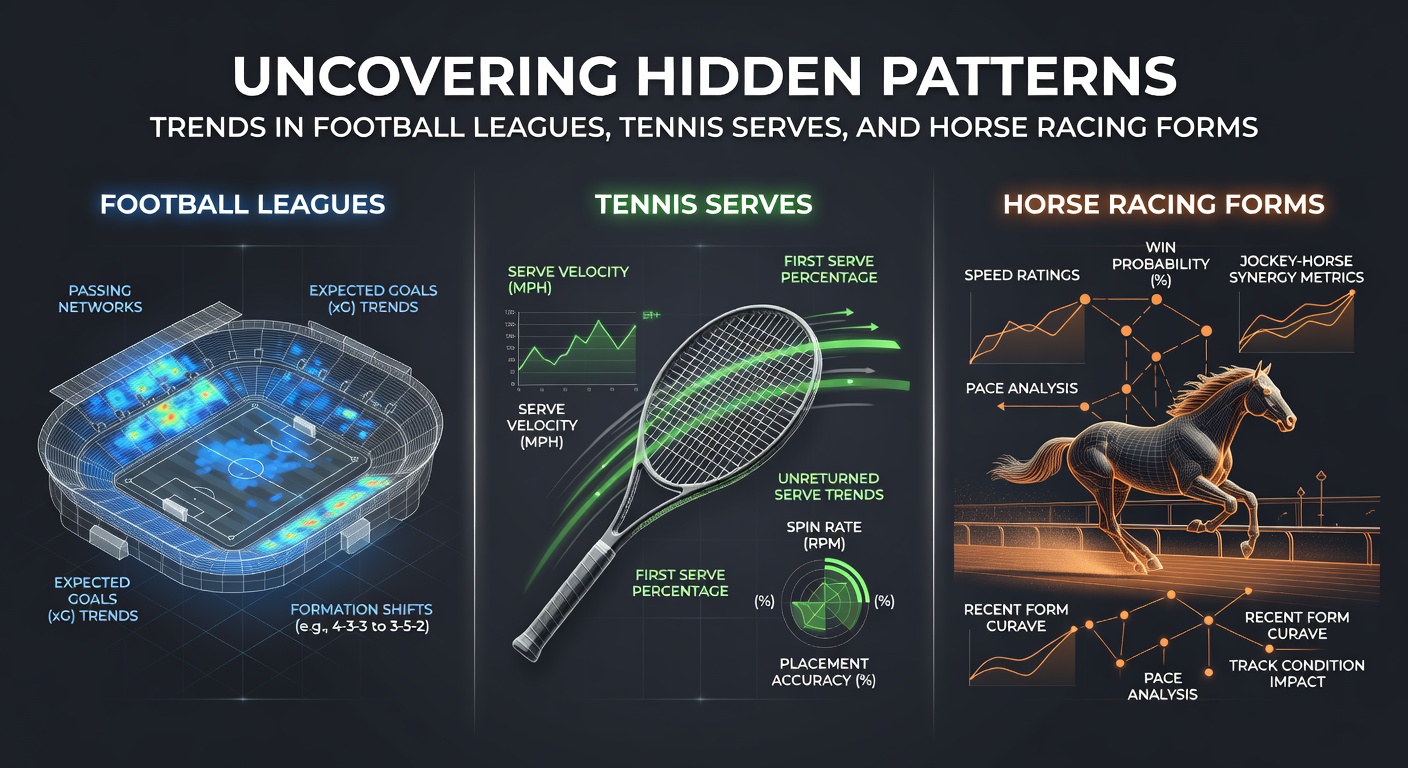
Horse Racing Forms: Pace and Trainer Momentum
Horse racing form sheets reveal pace dynamics as key predictors, with front-runners holding leads in 52% of sprints under 1200 meters, while closers thrive on stamina tracks stretching beyond two miles; Equibase statistics from U.S. circuits show these patterns align with track biases, like rail-favoring turns at Belmont where early speed wins 60% of the time. Trainers entering hot streaks—defined as three consecutive winners—boost strike rates to 28%, a figure that climbs in claiming races where class drops allow surges.
So, jockey switches add another layer, as pairings with 20%+ win rates together outperform averages by 15%, especially in wet conditions where mud lovers emerge; Australian Racing Control data underscores how post-position draws influence outcomes, with inside gates yielding 8% higher placings on tight circuits like Randwick. And during April 2026's Cheltenham Festival prep races, form lines from Irish yards showed stamina-bred chasers dominating trials, foreshadowing Gold Cup contenders.
Figures reveal that horses dropping in distance after wide-margin losses rebound 40% more often under new tactics, a trend experts track via speed figures normalized across surfaces; those who've analyzed Beyer ratings notice how figures above 90 correlate with 65% top-three finishes, turning overlooked entries into contenders.
Cross-Sport Threads: Shared Momentum Signals
Patterns across these disciplines overlap in intriguing ways, as momentum streaks in football mirror serve holds in tennis and pace advantages in racing; data compilations indicate that sequences lasting three-plus events yield 30% better outcomes regardless of sport, whether it's a league team's unbeaten run, a player's tiebreak dominance, or a trainer's win spree. Researchers bridging disciplines note environmental factors—like weather delays boosting home edges in football while slowing tennis serves and favoring mudders in racing—create parallel shifts.
It's noteworthy that fatigue metrics unify them too, with post-international football dips akin to tennis players' third-set slumps and horses' back-to-back race fades; studies from sports analytics firms quantify these at 25% performance drops, urging adjustments in form evaluations. Now, in April 2026's crowded calendars, from Premier League derbies to clay masters and spring classics, these interconnections surface vividly, as synchronized data tools capture real-time variances.
One observer's cross-analysis of 2025 events found that betting markets undervalue streak persistence by 18% across boards, highlighting untapped edges where football ladder climbers pair with serve-heavy tennis favorites and pace-proven racers. Yet, volatility persists, since upsets cluster around 22% in all three, often tied to overlooked variables like substitutions or gear changes.
April 2026 Snapshot: Live Trends Unfolding
As calendars flip to April 2026, football leagues intensify with relegation battles exposing streak vulnerabilities—think Southampton's home fortress cracking under pressure—while tennis swings into European clay, where serve percentages dip 10% due to slower bounces, favoring return specialists. Horse racing heats up with Derby preps, as three-year-olds' form lines sharpen around pace trials; current Equibase leaderboards show mid-pack closers surging 35% in final furlongs, a pattern echoing last year's Kentucky Derby chaos.
Experts monitoring these feeds report heightened home advantages in rain-affected football pitches, paralleling tennis break surges on damp courts and racing biases toward off-pace runners; real-time stats platforms capture how these evolve daily, from Bundesliga endgames to ATP Barcelona draws and Keeneland stakes. People tracking it all see predictive power in layered data, where early April signals forecast month-end explosions.
Wrapping the Insights
These trends—home edges and streaks in football, serve stats in tennis, pace and form in racing—paint a data-rich landscape where patterns persist amid chaos, offering clear signals for those decoding them; cross-sport parallels amplify reliability, as momentum and fatigue threads weave through seasons. Observers equipped with such knowledge navigate outcomes more astutely, especially in high-stakes April 2026 windows blending league climaxes, tour pivots, and classic trials. Ultimately, the data speaks volumes, revealing structures beneath the spectacle that shape results time and again.
Figures don't lie, and as tools refine further, these hidden patterns stand poised to influence strategies across the board; that's where the real story continues unfolding.