Seasonal Cadences in Sports: Mapping Fixture Overloads, Tournament Phases, and Racing Calendars to Build Layered Strategies
Football leagues worldwide experience fixture congestion at predictable points in the calendar, particularly when domestic cups overlap with European competitions and international breaks, and observers note that teams in the Premier League or Serie A often face three matches within eight days during December and March windows. Data from league organizers shows increased player rotation during these stretches, which correlates with shifts in goal-scoring averages and defensive metrics tracked across multiple seasons.
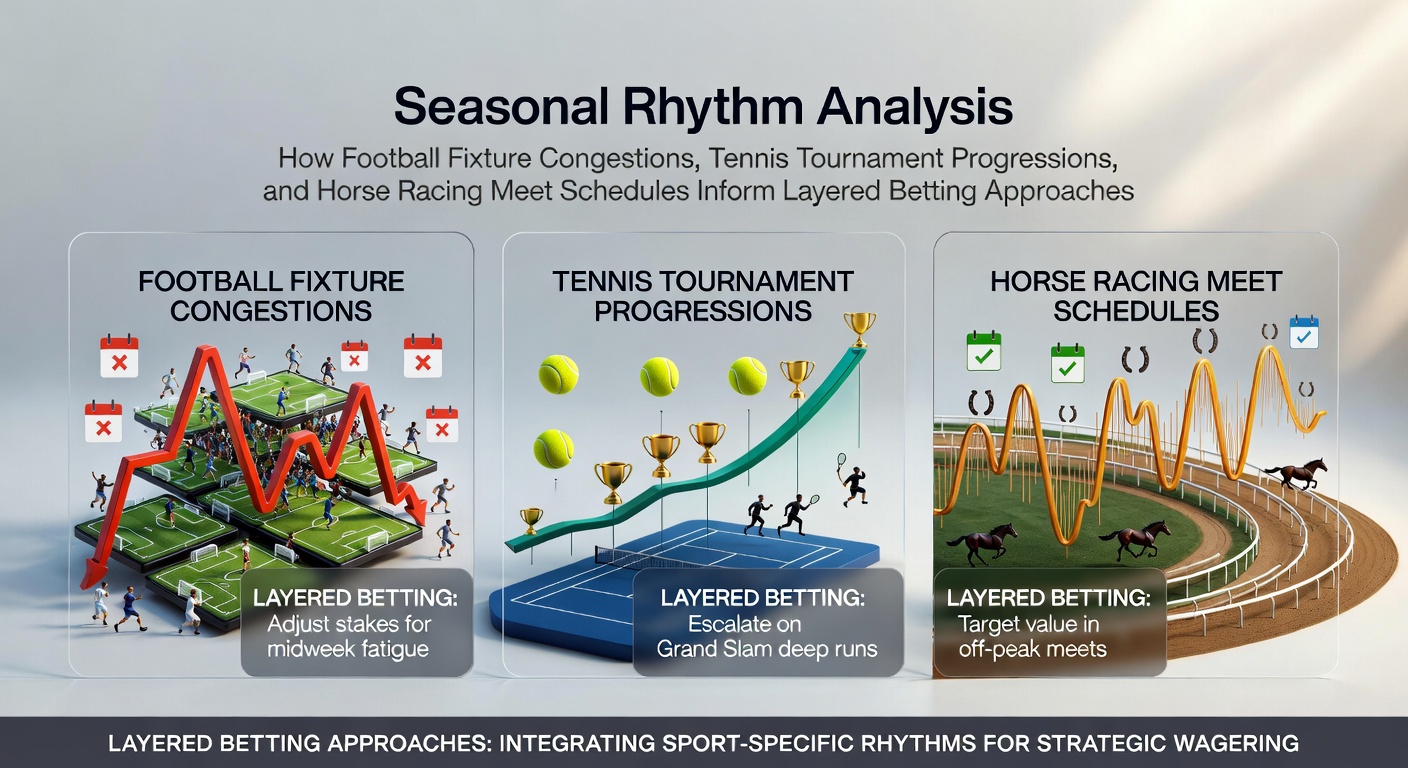
Football Fixture Congestions and Performance Layers
Teams navigating congested schedules demonstrate measurable declines in high-intensity running distance according to sports science reports, while those with larger squads maintain more consistent outputs. Analysts track how midweek fixtures influence weekend results, noting patterns such as reduced clean sheet percentages when travel distance exceeds 500 kilometers between matches. European competitions add another layer because clubs must balance Champions League group stages with domestic league demands, and historical records from UEFA seasons reveal distinct recovery timelines for squads crossing borders.
Tennis Tournament Progressions and Momentum Tracking
Grand Slam events unfold over two weeks with best-of-five set formats in later rounds, creating clear progression stages where physical demands escalate for players advancing deep into draws. Surface transitions from hard courts in early-year majors to clay in spring tournaments produce documented changes in rally lengths and break-point conversion rates, as compiled in ATP and WTA statistical archives. Smaller ATP 250 events slot into the calendar between majors, allowing lower-ranked players to accumulate ranking points while top seeds manage energy across the season's four surfaces.
Horse Racing Meet Schedules and Form Cycles
Flat racing seasons align with weather patterns and track conditions, with major festivals such as Royal Ascot in June and the Breeders' Cup in November serving as focal points where field sizes and prize money influence participation rates. Jockey and trainer statistics collected by bodies like Racing Australia and the Hong Kong Jockey Club show seasonal peaks in win percentages tied to specific meeting frequencies, while National Hunt calendars in colder months introduce variables like ground softness that affect speed figures. Handicappers adjust ratings after each meet, producing layered data sets that reflect both individual horse development and broader seasonal rhythms.
Integrating Rhythms into Layered Models
Layered approaches combine these elements by aligning football congestion windows with tennis draw stages and racing festival dates to identify overlapping opportunity periods. In May 2026, for example, the conclusion of most European domestic leagues coincides with the start of the French Open and several high-profile flat racing cards, creating a compressed timeframe where performance data from one sport can inform cross-referencing with another. Models often weight recent fixture density for football sides, set counts for tennis competitors, and recent runs over similar distances for racehorses, then apply filters based on historical correlations reported in academic sports analytics papers.
One research project from the University of Queensland examined multi-sport scheduling overlaps and found measurable interactions between fixture density and betting market efficiency during peak periods. Another study released by the Canadian Centre on Substance Use and Addiction explored how calendar-driven form cycles appear across different disciplines, providing baseline datasets for constructing sequential selection frameworks.
Conclusion
Seasonal rhythm analysis relies on observable patterns in fixture lists, tournament brackets, and meet timetables rather than isolated events. By mapping these calendars together, structured frameworks emerge that connect performance indicators across football, tennis, and horse racing through documented statistical relationships.