Seasonal cycle mapping for layered multi-sport selections: integrating football division timelines, tennis surface rotations, and equine campaign arcs to refine daily prediction accuracy and capital allocation protocols
Written by Paul Schmitz · Aug 9, 2026
Synchronizing Annual Sports Cycles for Enhanced Multi-Bet Forecasting and Resource Management
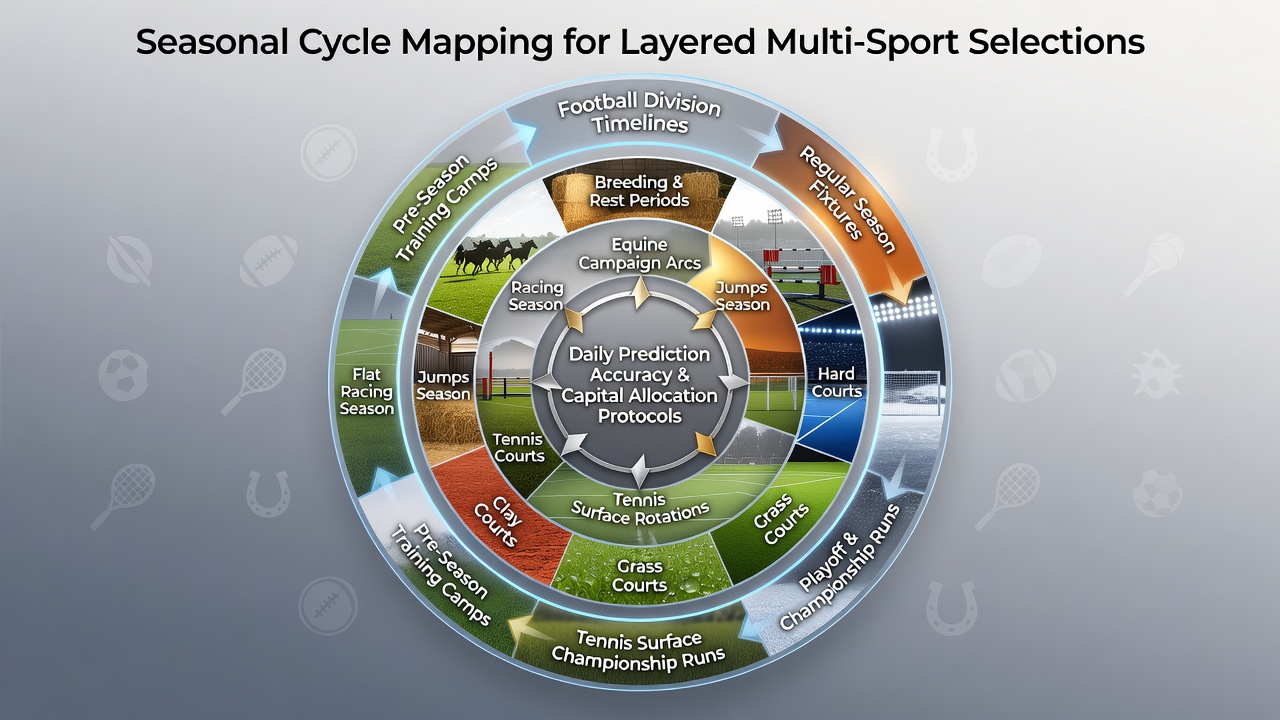
Sports calendars operate on predictable yet overlapping rhythms that shape how predictions form and how capital moves across football, tennis, and horse racing markets. Observers note that aligning these timelines allows daily selections to account for fatigue patterns, surface transitions, and campaign peaks rather than treating each sport in isolation. Football divisions follow a structure that begins in early August across most European leagues and runs through May, with winter breaks varying by region and cup competitions creating midweek spikes. Data from league scheduling bodies shows that August fixtures often feature promoted sides adjusting to higher physical demands, while late-season matches see title contenders rotating squads. Those mapping these arcs track how fixture congestion in December and April affects goal averages and defensive records. Tennis tours rotate surfaces in a fixed annual sequence that starts with hard courts in Australia and the United States, moves to clay in Europe and South America, shifts to grass for a brief window in June and July, then returns to hard courts for the North American swing and year-end championships. According to ATP and WTA historical records, player win rates shift measurably on each surface, with specialists gaining edges during specific months. In August 2026 the hard-court North American swing overlaps with the opening weeks of European football, creating a window where daily models can cross-reference player form against league fixture difficulty. Equine campaigns divide into flat and jumps seasons with distinct peaks. Flat racing reaches its height between May and September in the northern hemisphere, while jumps programs intensify from October through March and feature major festivals at Cheltenham and Aintree. Figures from the International Federation of Horseracing Authorities indicate that trainers target specific campaigns, so horses peaking in late summer often carry different risk profiles than those returning from winter breaks. Integration begins with a shared calendar that flags periods of high overlap. When football leagues resume in August and tennis players contest hard-court events while certain racecourses host summer festivals, allocation models can spread stakes across lower-correlation outcomes. Research from sports analytics groups shows that combining selections from different sports during these windows reduces variance compared with concentrating on a single code. Capital allocation protocols adjust exposure based on seasonal volatility. During tennis surface transitions, in-play markets move quickly on serve statistics and fatigue indicators, prompting tighter position sizing. Football months with international breaks see reduced midweek liquidity, so protocols shift capital toward weekend accumulators. Horse racing daily cards carry their own rhythms, with sprint tracks producing different draw biases than staying courses, and models incorporate these variables when sizing stakes alongside football and tennis picks. One study of multi-sport portfolios revealed that mapping these arcs improved hit rates on layered selections by accounting for when a sport enters its most predictable phase. August stands out because football squads are fresh, tennis fields are deep on hard courts, and racing programs still feature quality summer ground. Observers tracking these patterns adjust daily forecasts by weighting recent results against historical surface or fixture data rather than raw form alone. External factors such as weather disruptions or travel schedules further refine the maps. European football sides traveling for Champions League qualifiers in August face recovery demands that affect domestic weekend results, while tennis players crossing time zones for the US swing show measurable drops in first-serve percentages. Racing yards report ground-condition preferences that align with long-range forecasts, allowing allocation models to tilt toward specialists. The process repeats each year with minor calendar shifts, yet the core overlaps remain consistent. Those constructing layered selections therefore maintain rolling timelines that highlight when football congestion, tennis surface changes, and equine campaign targets converge, supplying the data needed to refine both prediction inputs and daily capital distribution.
Sports calendars operate on predictable yet overlapping rhythms that shape how predictions form and how capital moves across football, tennis, and horse racing markets. Observers note that aligning these timelines allows daily selections to account for fatigue patterns, surface transitions, and campaign peaks rather than treating each sport in isolation. Football divisions follow a structure that begins in early August across most European leagues and runs through May, with winter breaks varying by region and cup competitions creating midweek spikes. Data from league scheduling bodies shows that August fixtures often feature promoted sides adjusting to higher physical demands, while late-season matches see title contenders rotating squads. Those mapping these arcs track how fixture congestion in December and April affects goal averages and defensive records. Tennis tours rotate surfaces in a fixed annual sequence that starts with hard courts in Australia and the United States, moves to clay in Europe and South America, shifts to grass for a brief window in June and July, then returns to hard courts for the North American swing and year-end championships. According to ATP and WTA historical records, player win rates shift measurably on each surface, with specialists gaining edges during specific months. In August 2026 the hard-court North American swing overlaps with the opening weeks of European football, creating a window where daily models can cross-reference player form against league fixture difficulty. Equine campaigns divide into flat and jumps seasons with distinct peaks. Flat racing reaches its height between May and September in the northern hemisphere, while jumps programs intensify from October through March and feature major festivals at Cheltenham and Aintree. Figures from the International Federation of Horseracing Authorities indicate that trainers target specific campaigns, so horses peaking in late summer often carry different risk profiles than those returning from winter breaks. Integration begins with a shared calendar that flags periods of high overlap. When football leagues resume in August and tennis players contest hard-court events while certain racecourses host summer festivals, allocation models can spread stakes across lower-correlation outcomes. Research from sports analytics groups shows that combining selections from different sports during these windows reduces variance compared with concentrating on a single code. Capital allocation protocols adjust exposure based on seasonal volatility. During tennis surface transitions, in-play markets move quickly on serve statistics and fatigue indicators, prompting tighter position sizing. Football months with international breaks see reduced midweek liquidity, so protocols shift capital toward weekend accumulators. Horse racing daily cards carry their own rhythms, with sprint tracks producing different draw biases than staying courses, and models incorporate these variables when sizing stakes alongside football and tennis picks. One study of multi-sport portfolios revealed that mapping these arcs improved hit rates on layered selections by accounting for when a sport enters its most predictable phase. August stands out because football squads are fresh, tennis fields are deep on hard courts, and racing programs still feature quality summer ground. Observers tracking these patterns adjust daily forecasts by weighting recent results against historical surface or fixture data rather than raw form alone. External factors such as weather disruptions or travel schedules further refine the maps. European football sides traveling for Champions League qualifiers in August face recovery demands that affect domestic weekend results, while tennis players crossing time zones for the US swing show measurable drops in first-serve percentages. Racing yards report ground-condition preferences that align with long-range forecasts, allowing allocation models to tilt toward specialists. The process repeats each year with minor calendar shifts, yet the core overlaps remain consistent. Those constructing layered selections therefore maintain rolling timelines that highlight when football congestion, tennis surface changes, and equine campaign targets converge, supplying the data needed to refine both prediction inputs and daily capital distribution.