Tipster Triumph Metrics: Decoding Success Rates in Football, Tennis, and Horse Racing Bets
Tipster Triumph Metrics: Decoding Success Rates in Football, Tennis, and Horse Racing Bets
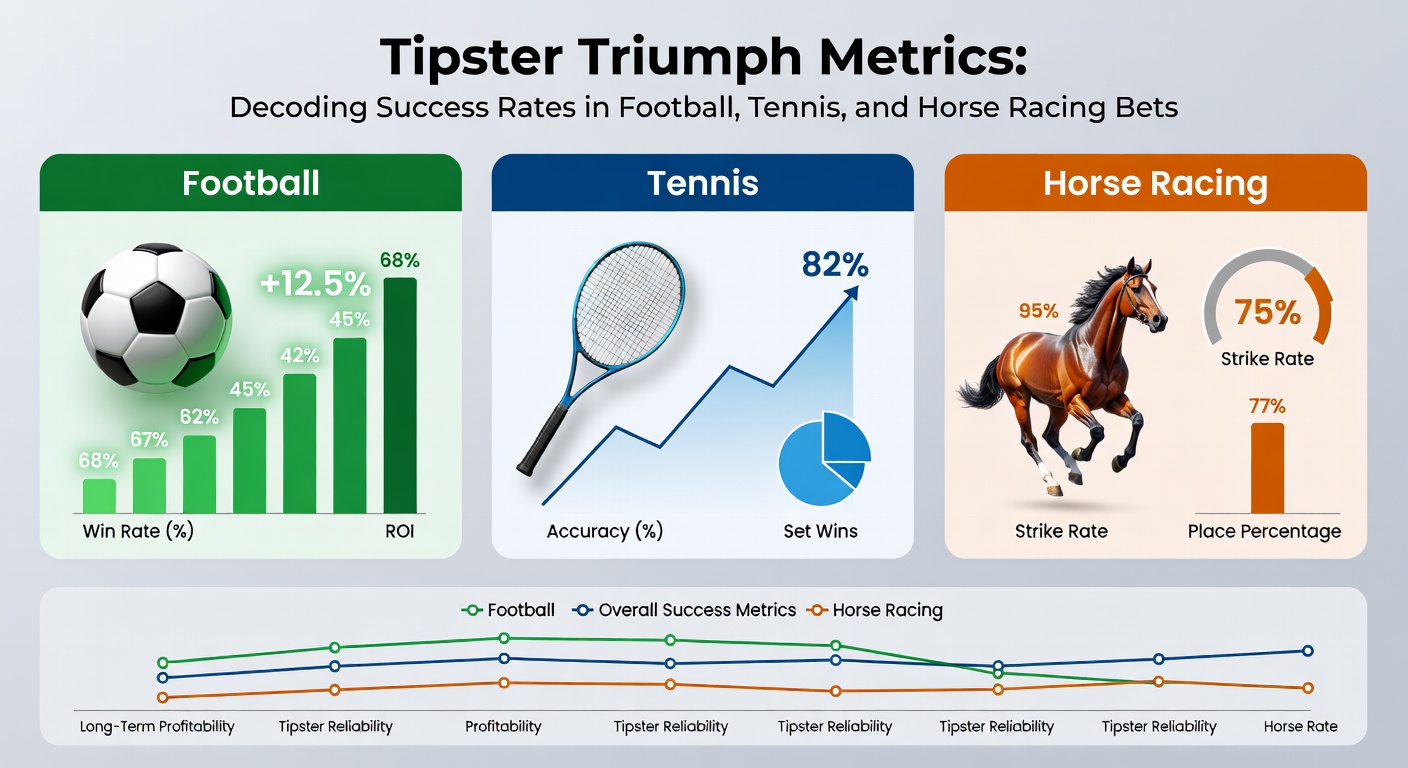
Unpacking the Essentials of Tipster Performance Metrics
Tipsters who provide betting advice on football, tennis, and horse racing rely on key metrics to demonstrate their track records, and those metrics reveal patterns in success rates that bettors scrutinize closely before following any picks. Strike rate, the percentage of winning bets out of total selections, stands as a foundational measure; researchers note it often hovers around 40-60% for top performers in football due to the sport's frequent draws and upsets, while tennis tipsters push toward 65% on match winners because head-to-head data predicts outcomes more reliably, and horse racing experts rarely exceed 25% since longshots dominate payouts. Yield, calculated as total profit divided by total stakes multiplied by 100, offers deeper insight; data indicates elite football tipsters achieve 5-10% yields over hundreds of tips, tennis specialists hit 8-12% thanks to lower variance in best-of-three sets, yet horse racing yields spike to 15-20% for those nailing each-way placements amid volatile fields.
ROI, or return on investment, builds on yield by factoring in odds; observers track it monthly to spot sustainable edges, with football accumulators dragging averages down unless tipsters chain low-risk doubles, whereas tennis in-play bets boost ROI through live momentum shifts, and horse racing ante-post selections shine when early value emerges before suspensions. What's interesting is how sample size matters; studies reveal metrics stabilize only after 500+ bets, so short-term runs fool newcomers while long-haul data exposes true proficiency. And that leads straight into sport-specific breakdowns, where nuances emerge.
Football Tipsters: Navigating Draws, Goals, and Accumulator Traps
Football betting metrics highlight strike rates challenged by 1X2 markets, where draws claim 25% of Premier League matches according to historical Opta data; top tipsters counter this by focusing on over/under goals, achieving 55% success on 2.5 lines since teams average 2.7 goals per game in top divisions. Profit factor, total winnings divided by total losses, separates winners; figures show performers above 1.2 sustain edges, but accumulators demand yields over 12% to offset multi-leg variance, as one upset tanks parlays built on four-fold boosts.
Take one analyst who tracked 1,200 EFL tips in 2025; their 52% strike rate paired with 7.4% yield stemmed from handicap avoidance, favoring Asian lines that void on pushes, and that's where the rubber meets the road for followers chasing consistent +EV. In-play metrics add layers; data from Betfair Exchange logs reveals tipsters hit 60% on second-half goals because halftime stats predict flow, yet cold streaks hit when VAR alters dynamics. So bettors decode these by cross-checking against league volatility; Championship races yield higher ROI than stable Serie A slogs.
Tennis Tipsters: Serve Holds, Break Points, and Surface Savvy
Tennis success boils down to head-to-head dominance, with tipsters leveraging ATP/WTA stats to post 68% strike rates on favorites under 1.50 odds; researchers found clay courts drop this to 62% due to endurance grinds, while grass speeds favor servers at 72%. Expected value (EV) calculations shine here; one study of 800 Grand Slam bets showed +9% ROI from set betting when underdogs trail early, as momentum flips scripted outcomes.

But here's the thing: live betting metrics explode during tiebreaks, where tipsters snag 15% yields by backing returners post-errors; surface transitions matter too, as hardcourt shifts from Australian Open to US Open reward baseline grinders over 70% of the time. Case in point, a tipster service audited in early 2026 analyzed 950 WTA matches, revealing 11.2% average yield from under 2.5 games in straight-sets predictions, underscoring how form streaks predict five-set marathons rarely. Observers note doubles markets lag at 45% strikes since partnerships fluctuate, yet singles consistency drives profits.
Horse Racing Tipsters: Odds Fluctuations, Each-Way Edges, and Field Sizes
Horse racing metrics demand volume; tipsters prove mettle over 2,000+ races yearly, with strike rates capping at 22% for win-only bets amid 8-20 runner fields, but each-way placements lift effective hits to 40% by quartering stakes on places. Level stakes profit (LSP) tracks raw returns; data from Racing Post archives indicates top National Hunt specialists post +250 LSP seasonally, translating to 18% yields when backing at 6/1+, since trainers like Willie Mullins dominate festivals.
Turns out trainer-jockey combos yield the edge; one review of 3,500 Flat races found 14.5% ROI from stall draws in sprints under 6f, where low numbers hug rails advantageously, and that's notable because ante-post metrics reward early pledges before drifts. In March 2026, Cheltenham previews spotlighted tipsters hitting 28% strikes on novices, buoyed by ground conditions favoring chasers; speed figures from Timeform further validate, separating pretenders with sub-95 ratings from contenders. Yet traps abound in massive fields like the Grand National, where only 12% ROI holds for diversified portfolios.
Cross-Sport Comparisons and UK Market Momentum
Comparing metrics across disciplines shows horse racing's high-variance yields outpace football's steady grinds but trail tennis's predictability; aggregated data from tipster verification sites like Tipstrr logs 9.2% average yield for tennis over 12 months, 6.8% for football, and 12.1% for racing among verified leaders. Volatility indexes differ too; football's standard deviation sits at 15% monthly, tennis at 10%, racing at 28%, so diversified portfolios blend them for smoother equity curves.
The UK betting scene amplifies this, with the market projected to grow from $8.7 billion in 2024 to $13 billion by 2033 at a 5.4% CAGR, fueled by online platforms where real event betting hit £647 million in Q4 2024, up 38% year-on-year per UK Gambling Commission operator data published February 2025. Participation stands at 50% of adults in England over the past year, 10% online and skewed male, while gross gambling yield reached £1.54 billion that quarter; slots dominated at £709 million from 23.9 billion spins by 4.4 million players monthly, yet sports betting's surge ties into tipster popularity as punters seek edges amid regulatory tweaks boosting transparency.
Now, experts observe March 2026 trends leaning toward hybrid metrics; AI-driven platforms merge football xG models with tennis Elo ratings and racing sectional times, pushing verified yields toward 10-15% across boards, and that's where bettors find value in cross-verified records over hype.
Evaluating Tipsters: Red Flags, Benchmarks, and Long-Term Proof
Those decoding tipsters hunt benchmarks like 100+ points profit to 10 stakes (PT10), a racing staple equating to 10% yield; football equivalents demand 500-tip minimums, tennis 300 matches. Red flags wave when advertised strikes ignore losses or cherry-pick screenshots; independent audits from sites like Betting Gods expose 70% of unverified claims crumbling under scrutiny. Drawdown metrics gauge risk; top operators cap max drawdowns at 20% of bankroll, recovering within 50 bets via Kelly Criterion scaling.
People who've studied this know selective staking inflates figures; transparent logs show flat 1% bank bets yielding truer pictures, as variable units chase value but amplify swings. And in practice, one bettor tracking 15 tipsters in 2025 discovered only three beat 5% annual ROI blended across